Lean Canvas & Discovery
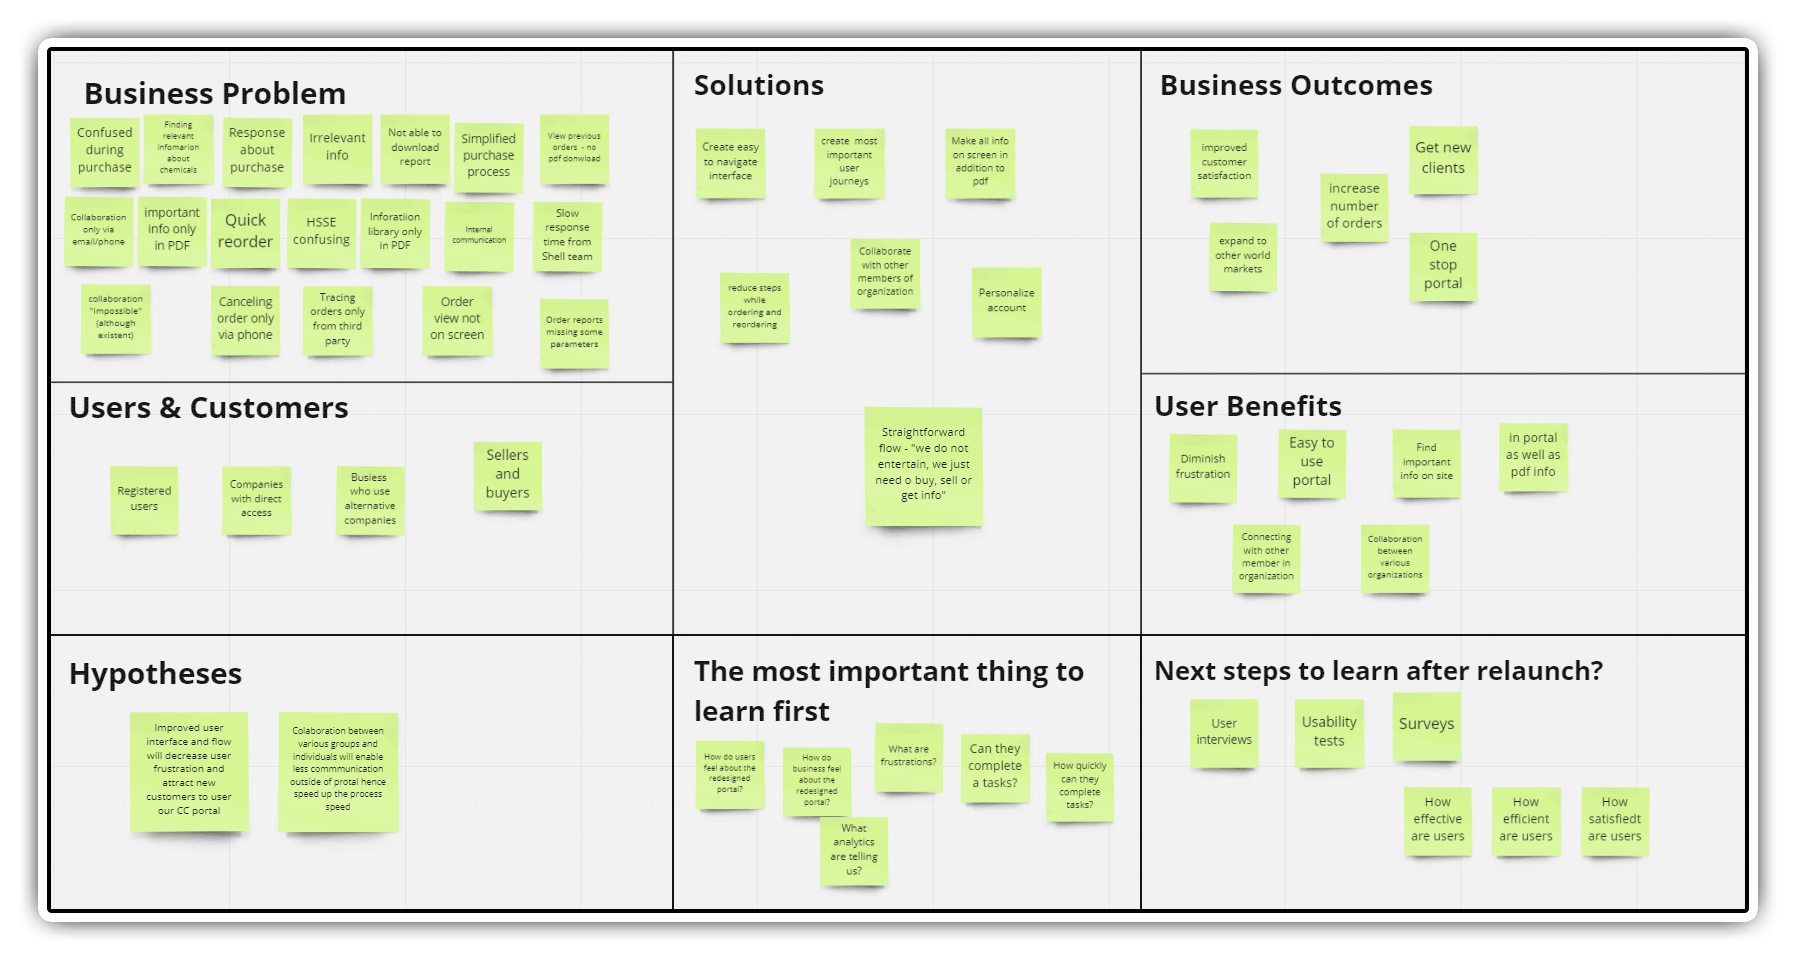
I facilitated workshops using the Lean Canvas to bridge the gap between Shell's sales goals and the actual pain points of customers. This ensured the team stayed focused on high-value features.
Senior UX/UI Product Designer · UX Design Lead · 20+ Years of Experience · AI-enabled product delivery
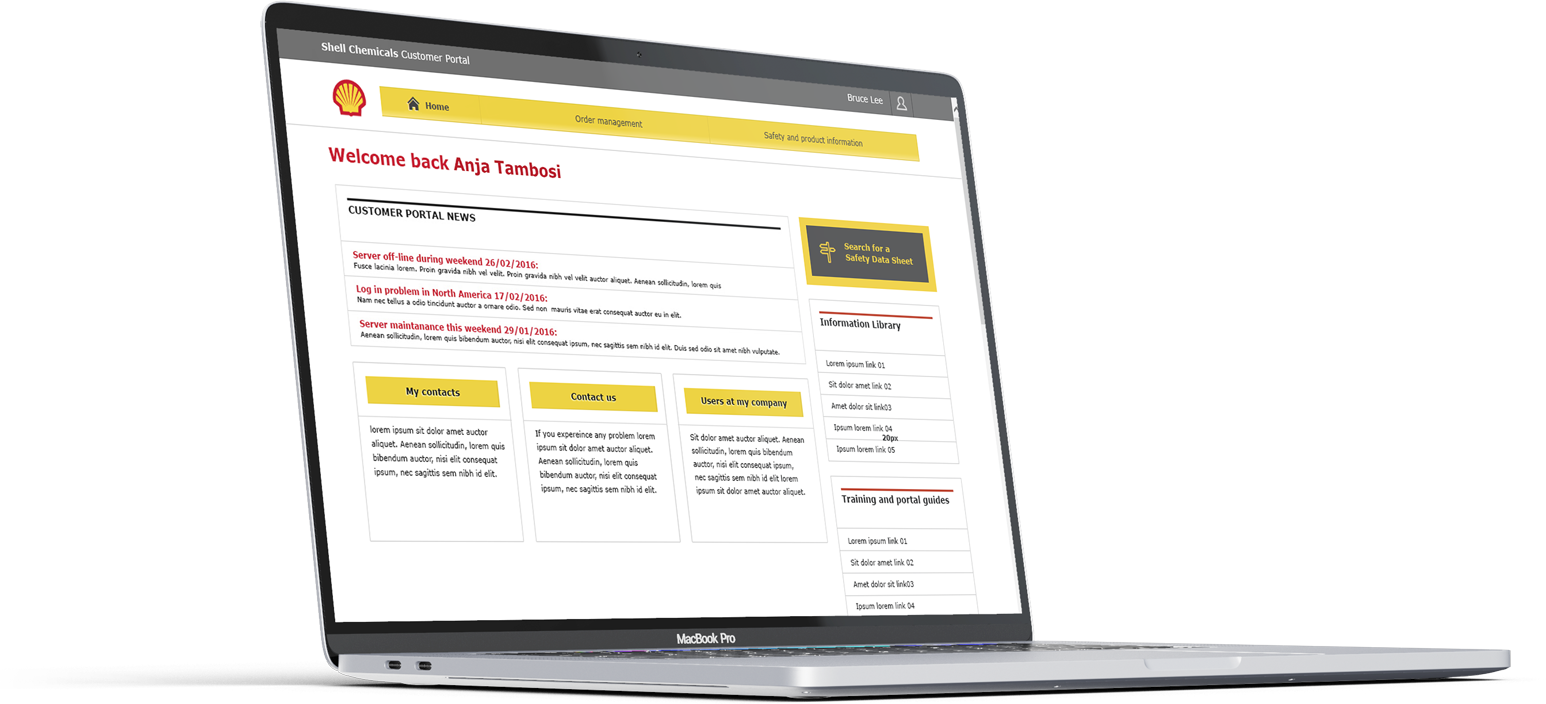
Digitizing a legacy B2B ecosystem. This project transformed a static, PDF-heavy portal into a mobile-responsive commerce engine, driving a 25% increase in client acquisition.
*Results based on 90-day post-launch analytics.
Active client base grew from 1,600 to 2,000+ accounts within the first quarter.
Optimization of the reorder flow reduced task completion time by nearly a third.
Responsive design captured a previously untapped segment of "in-the-field" users.
By moving critical data out of static documents and into dynamic UI components, we reduced the reorder flow from 8 steps to 5. This led to an 18% increase in repeat orders in the first month.
I facilitated workshops using the Lean Canvas to bridge the gap between Shell's sales goals and the actual pain points of customers. This ensured the team stayed focused on high-value features.
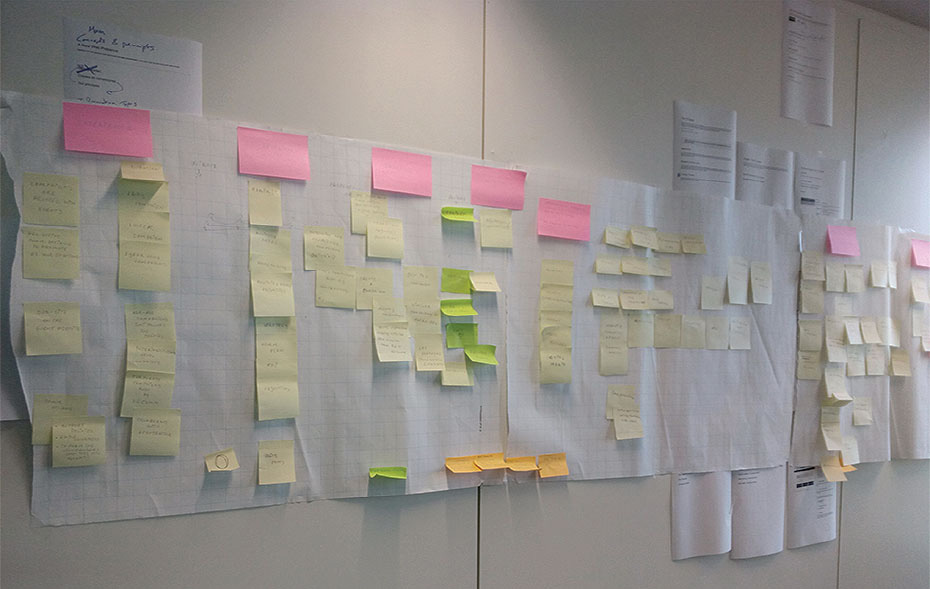
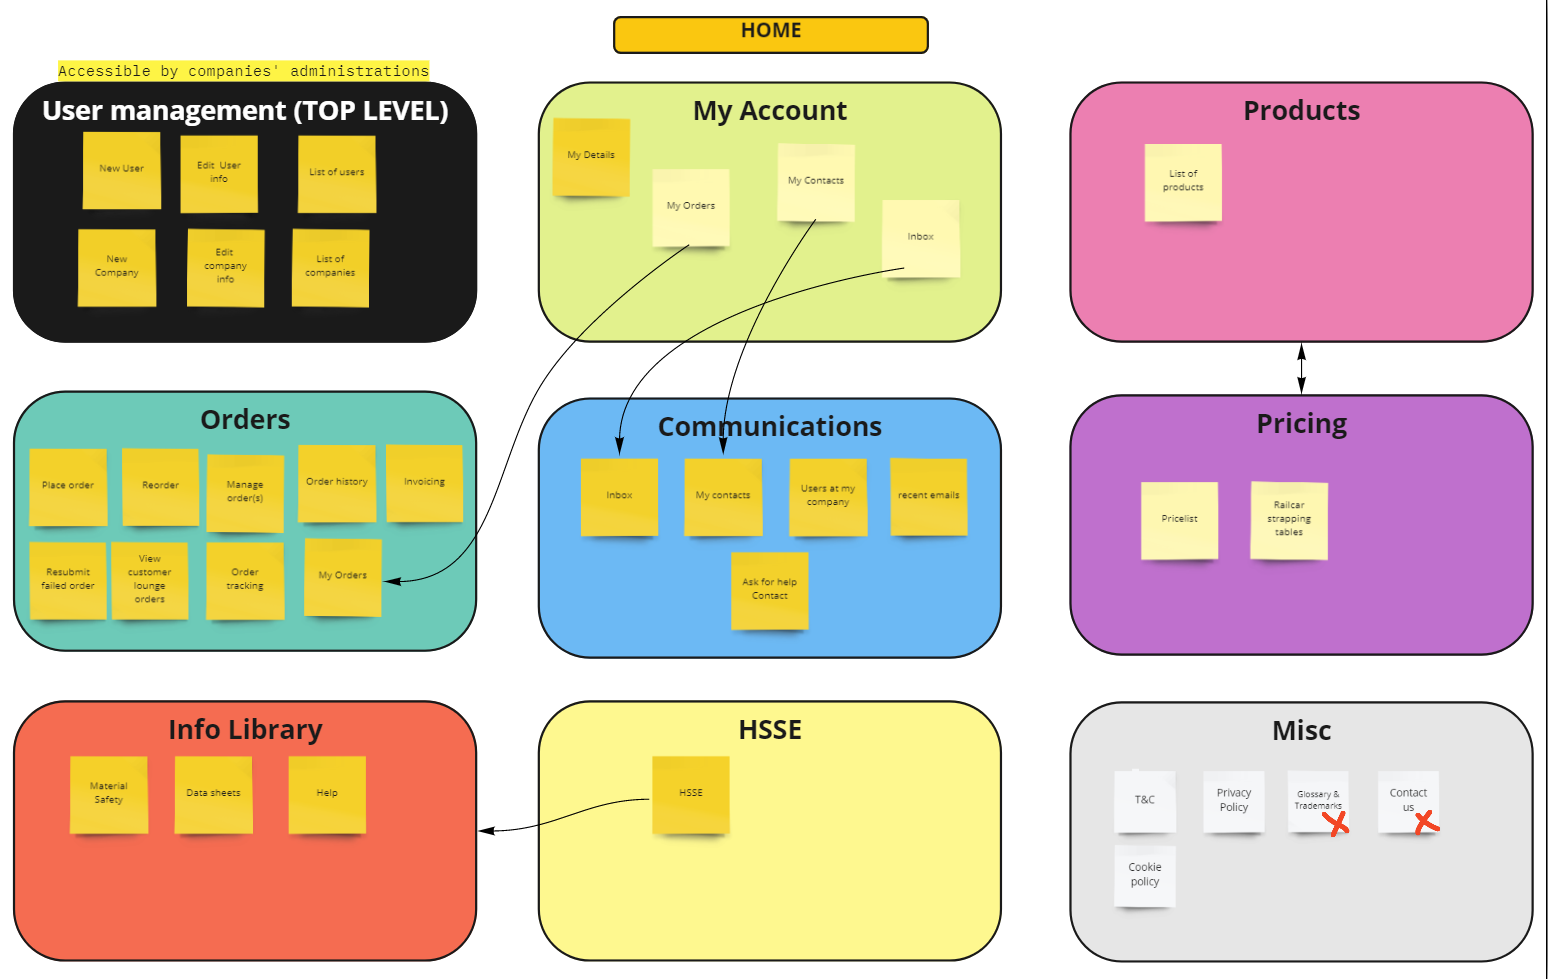
We audited the legacy ecosystem to expose navigation loops and "dead ends." This physical and digital mapping was crucial to convince stakeholders that a complete overhaul was necessary.
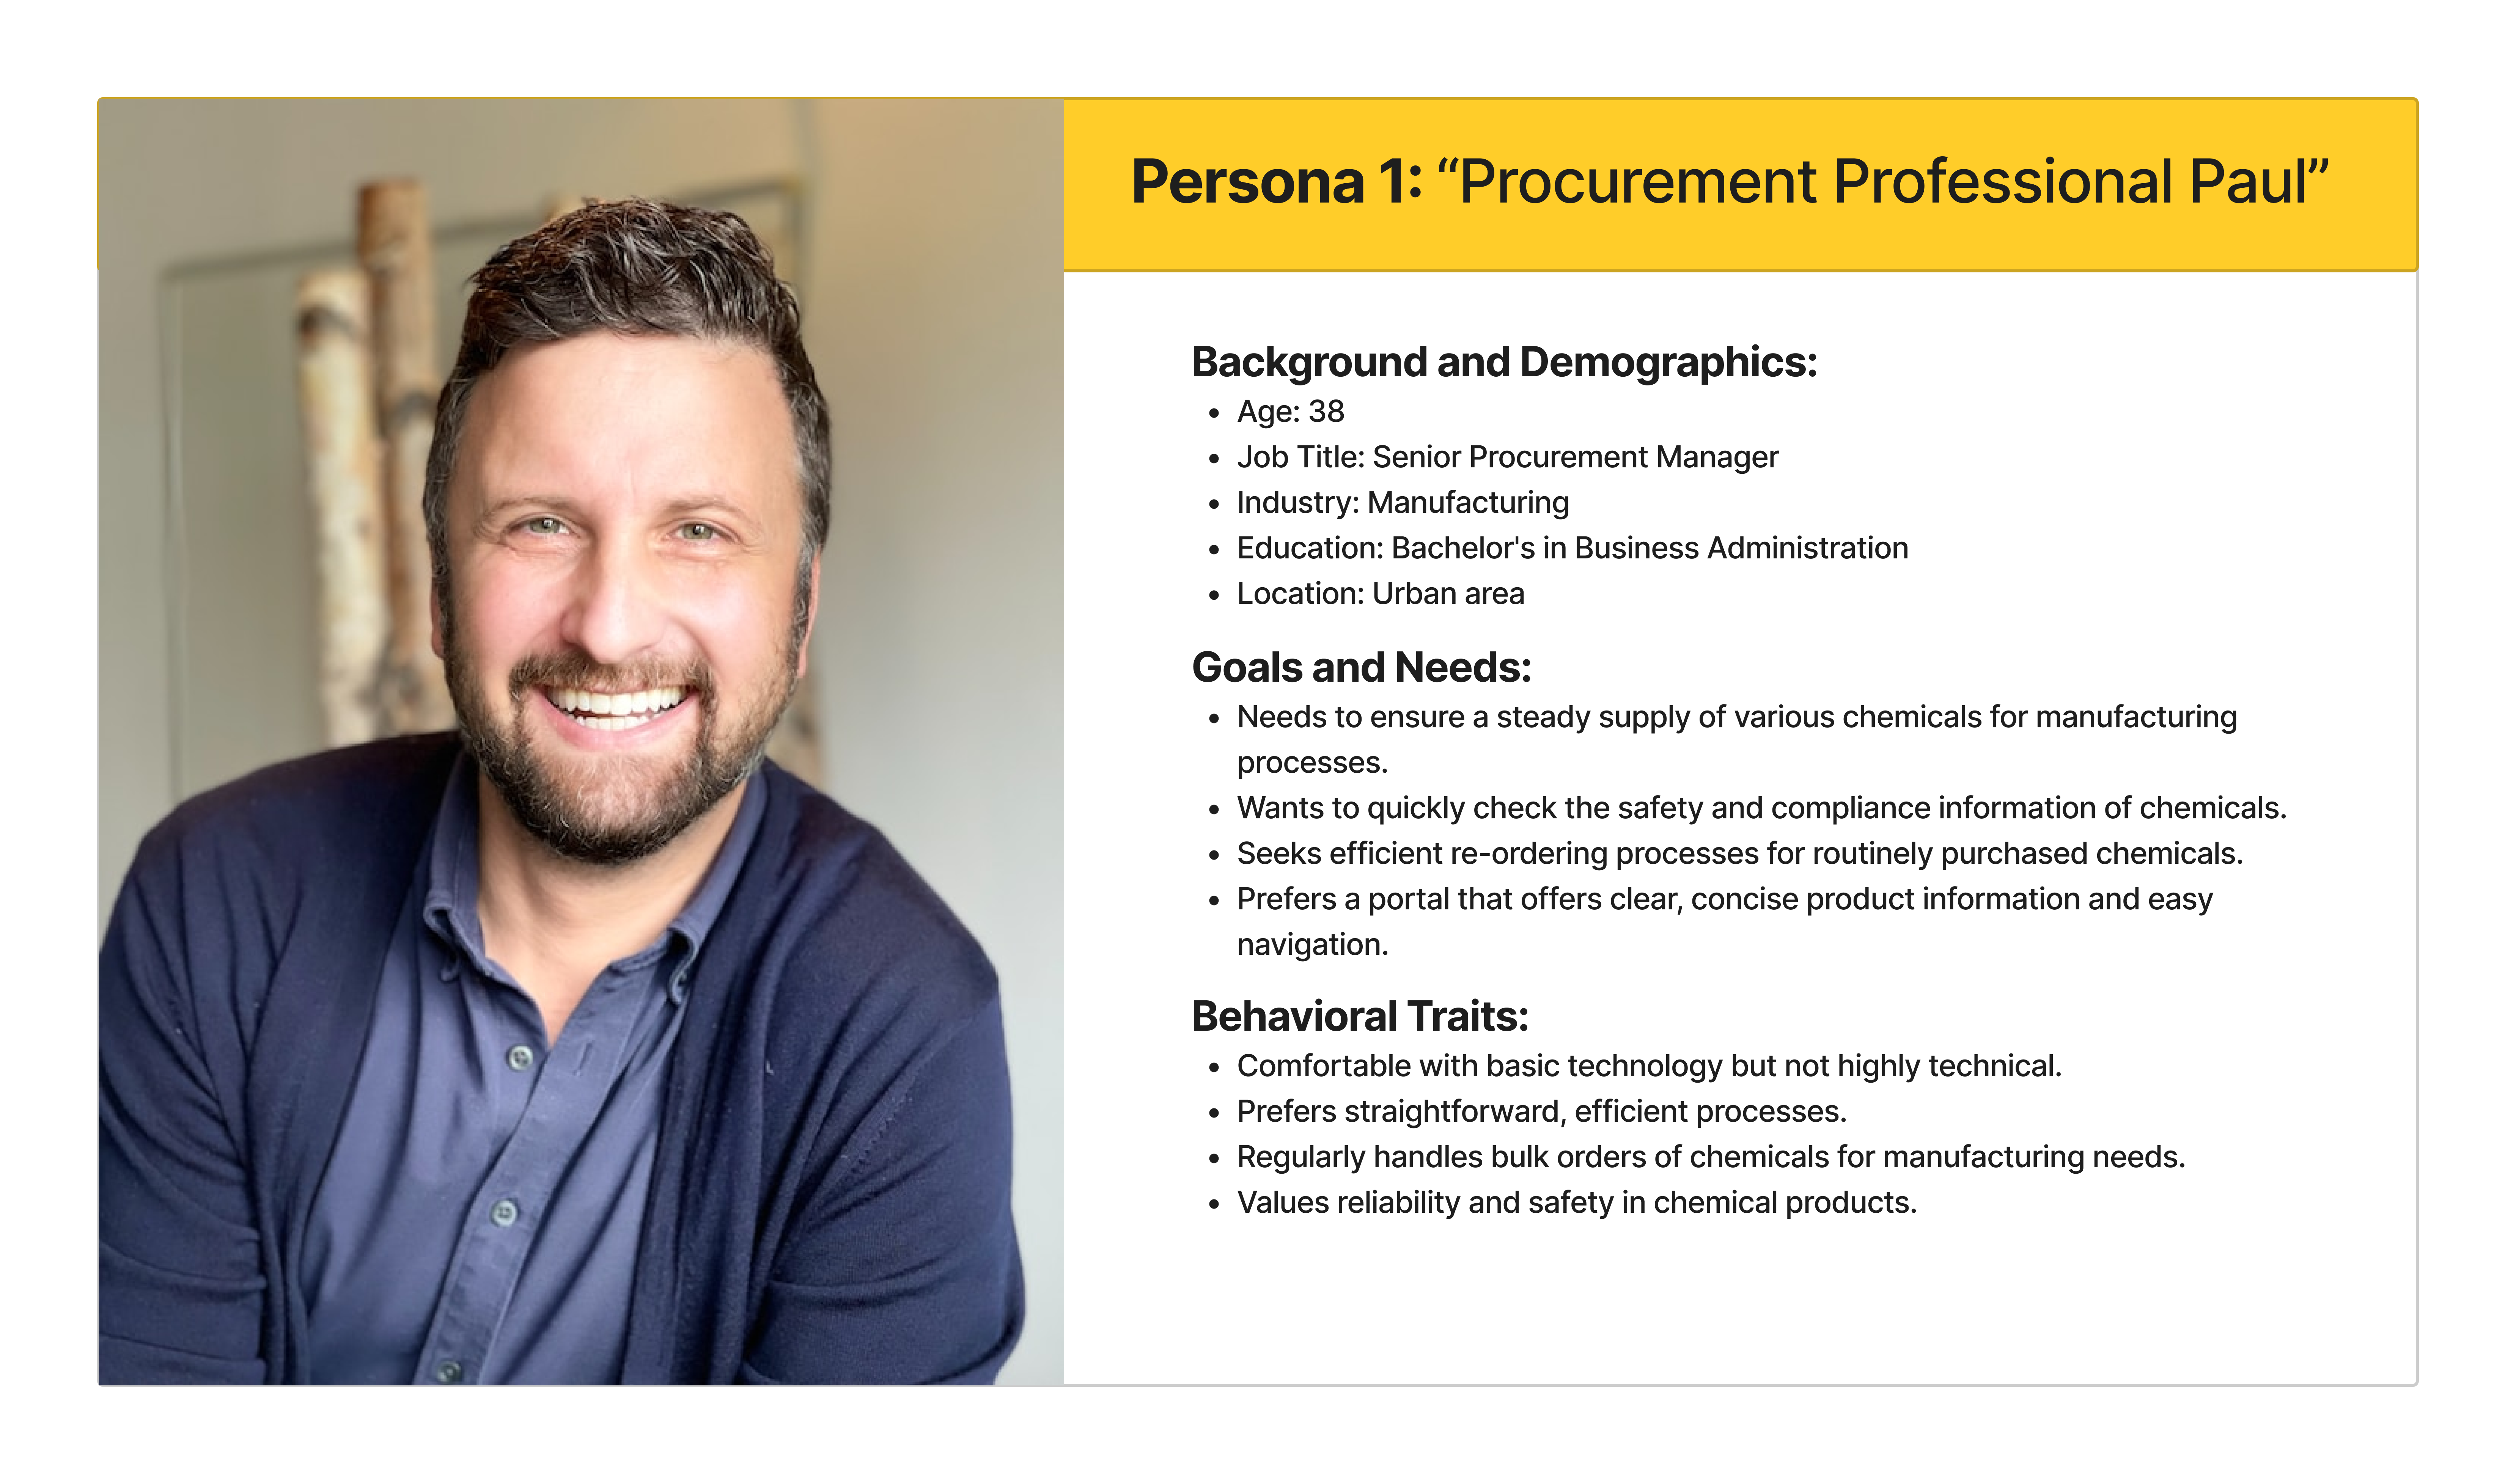
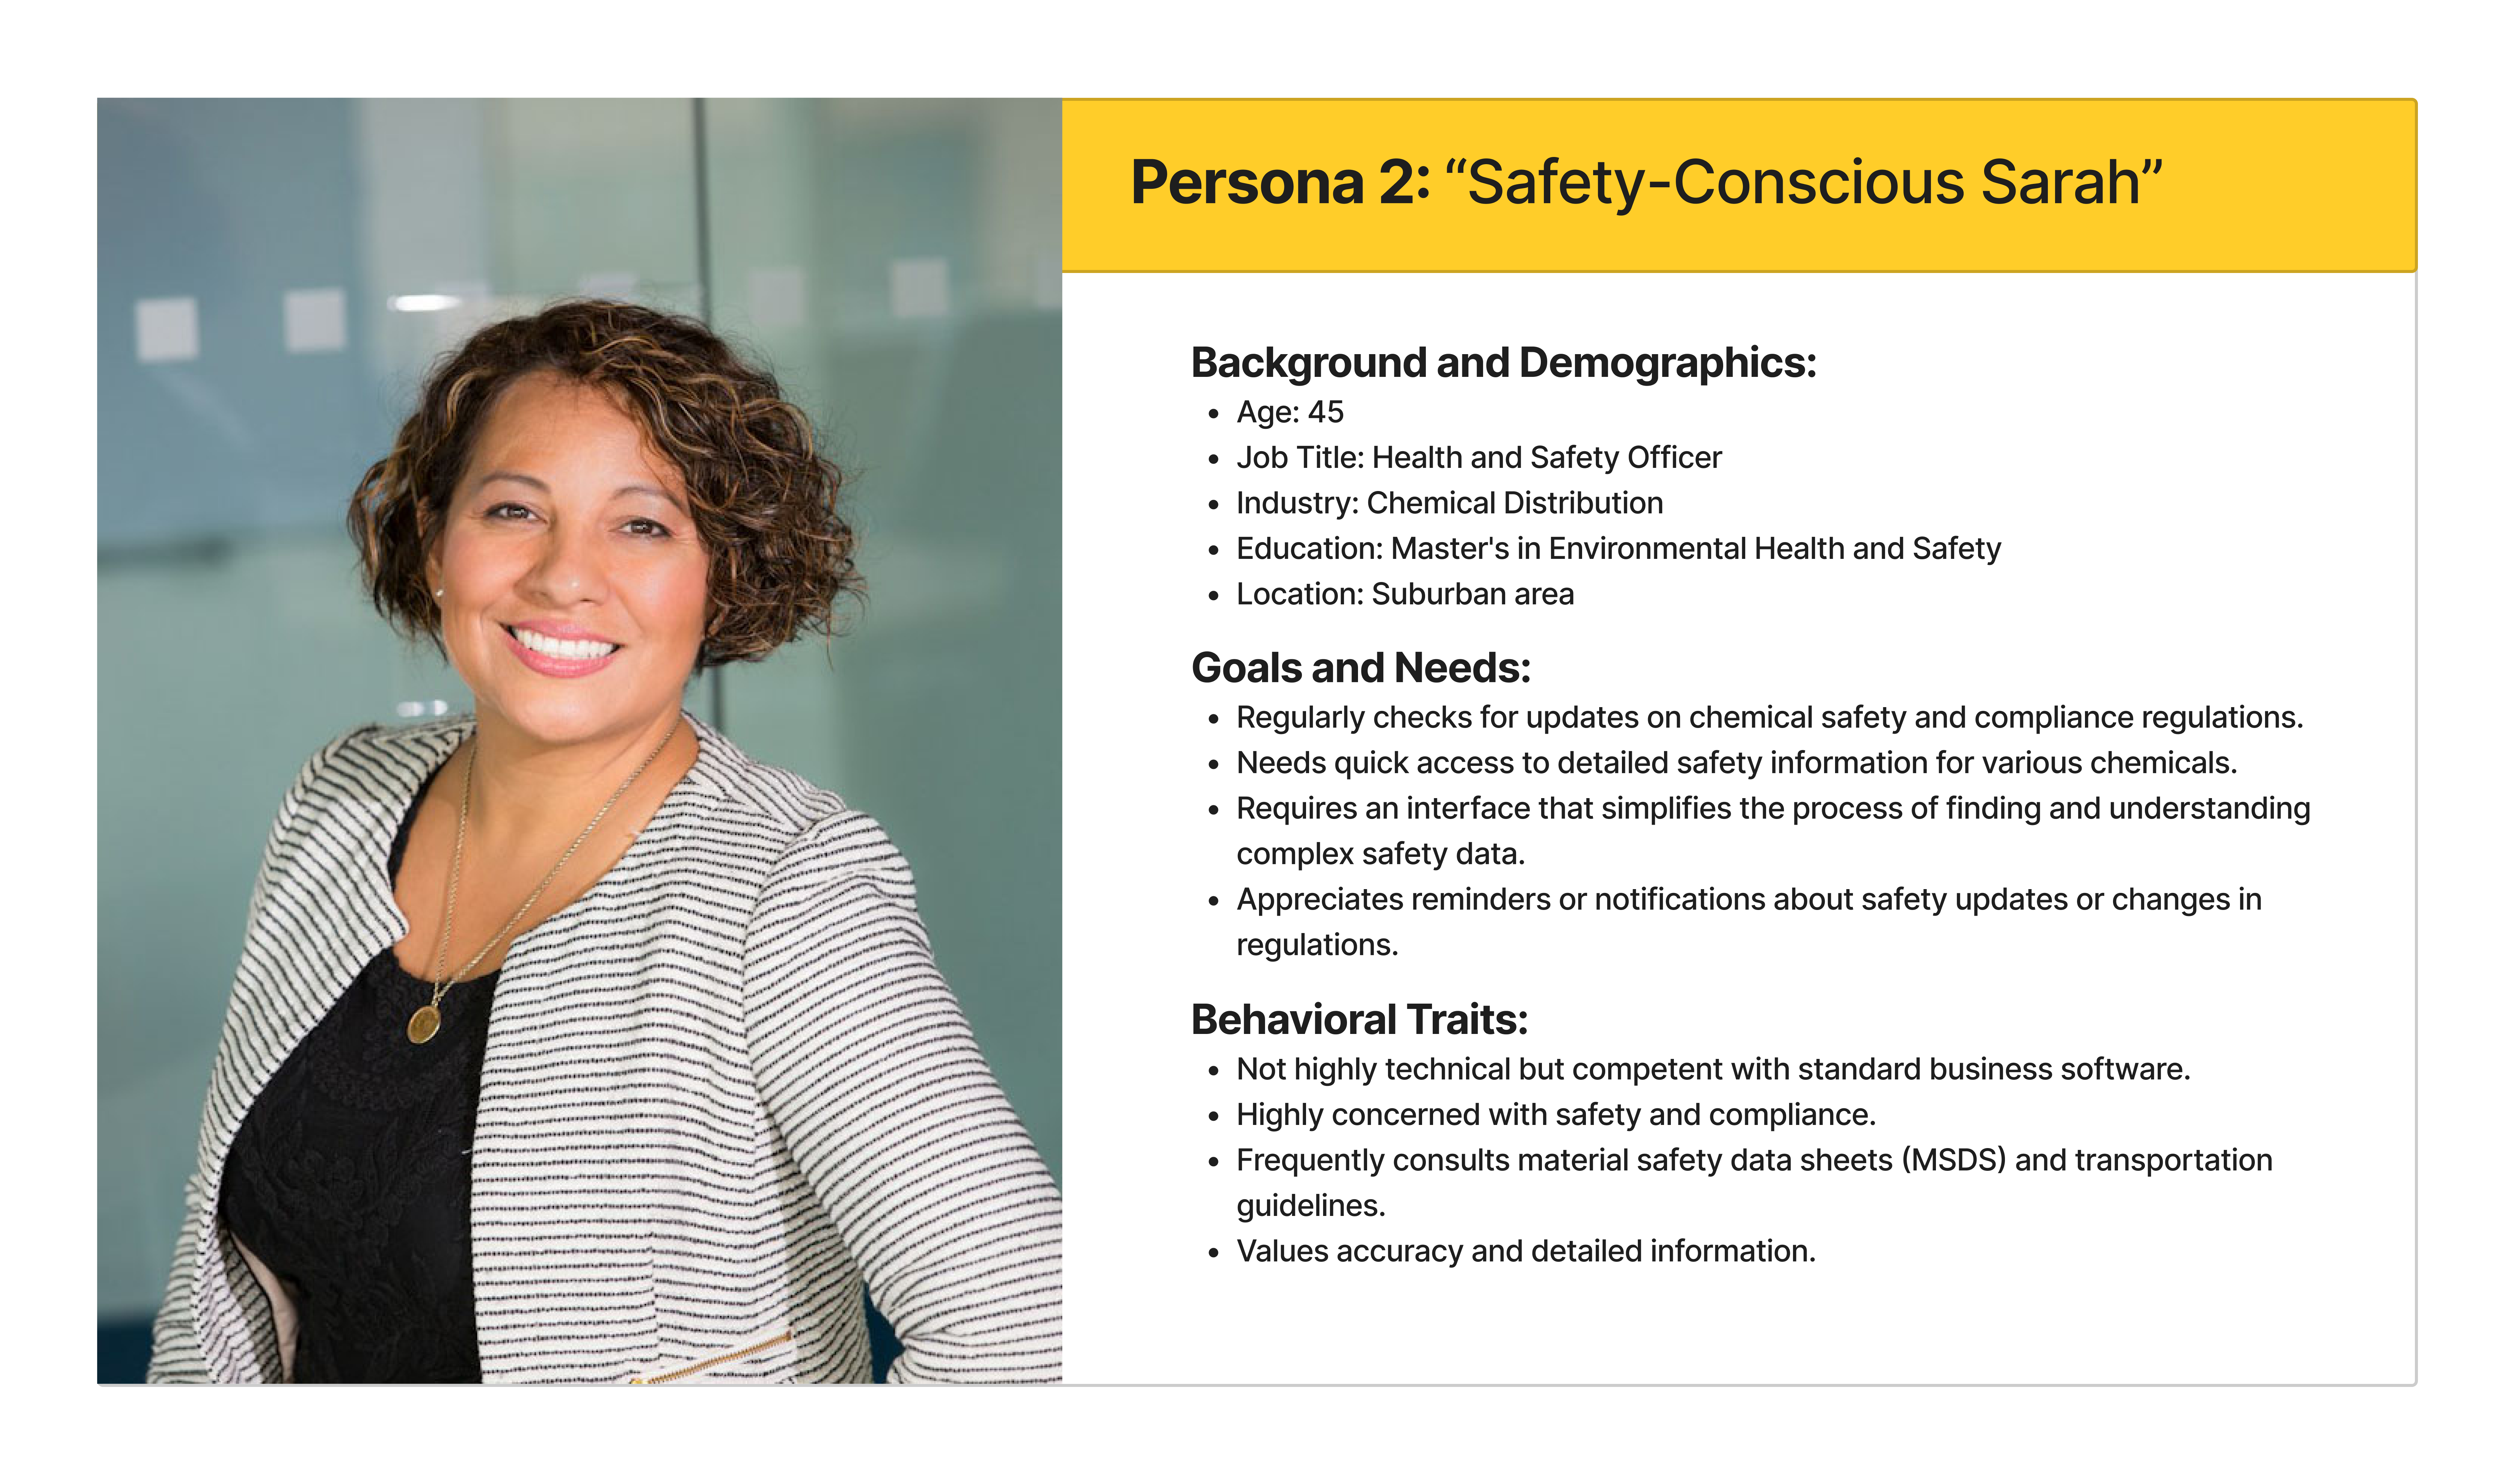
Based on global market data, we defined two primary archetypes. These personas ensured that every design decision served a specific user need, from bulk ordering to safety compliance.
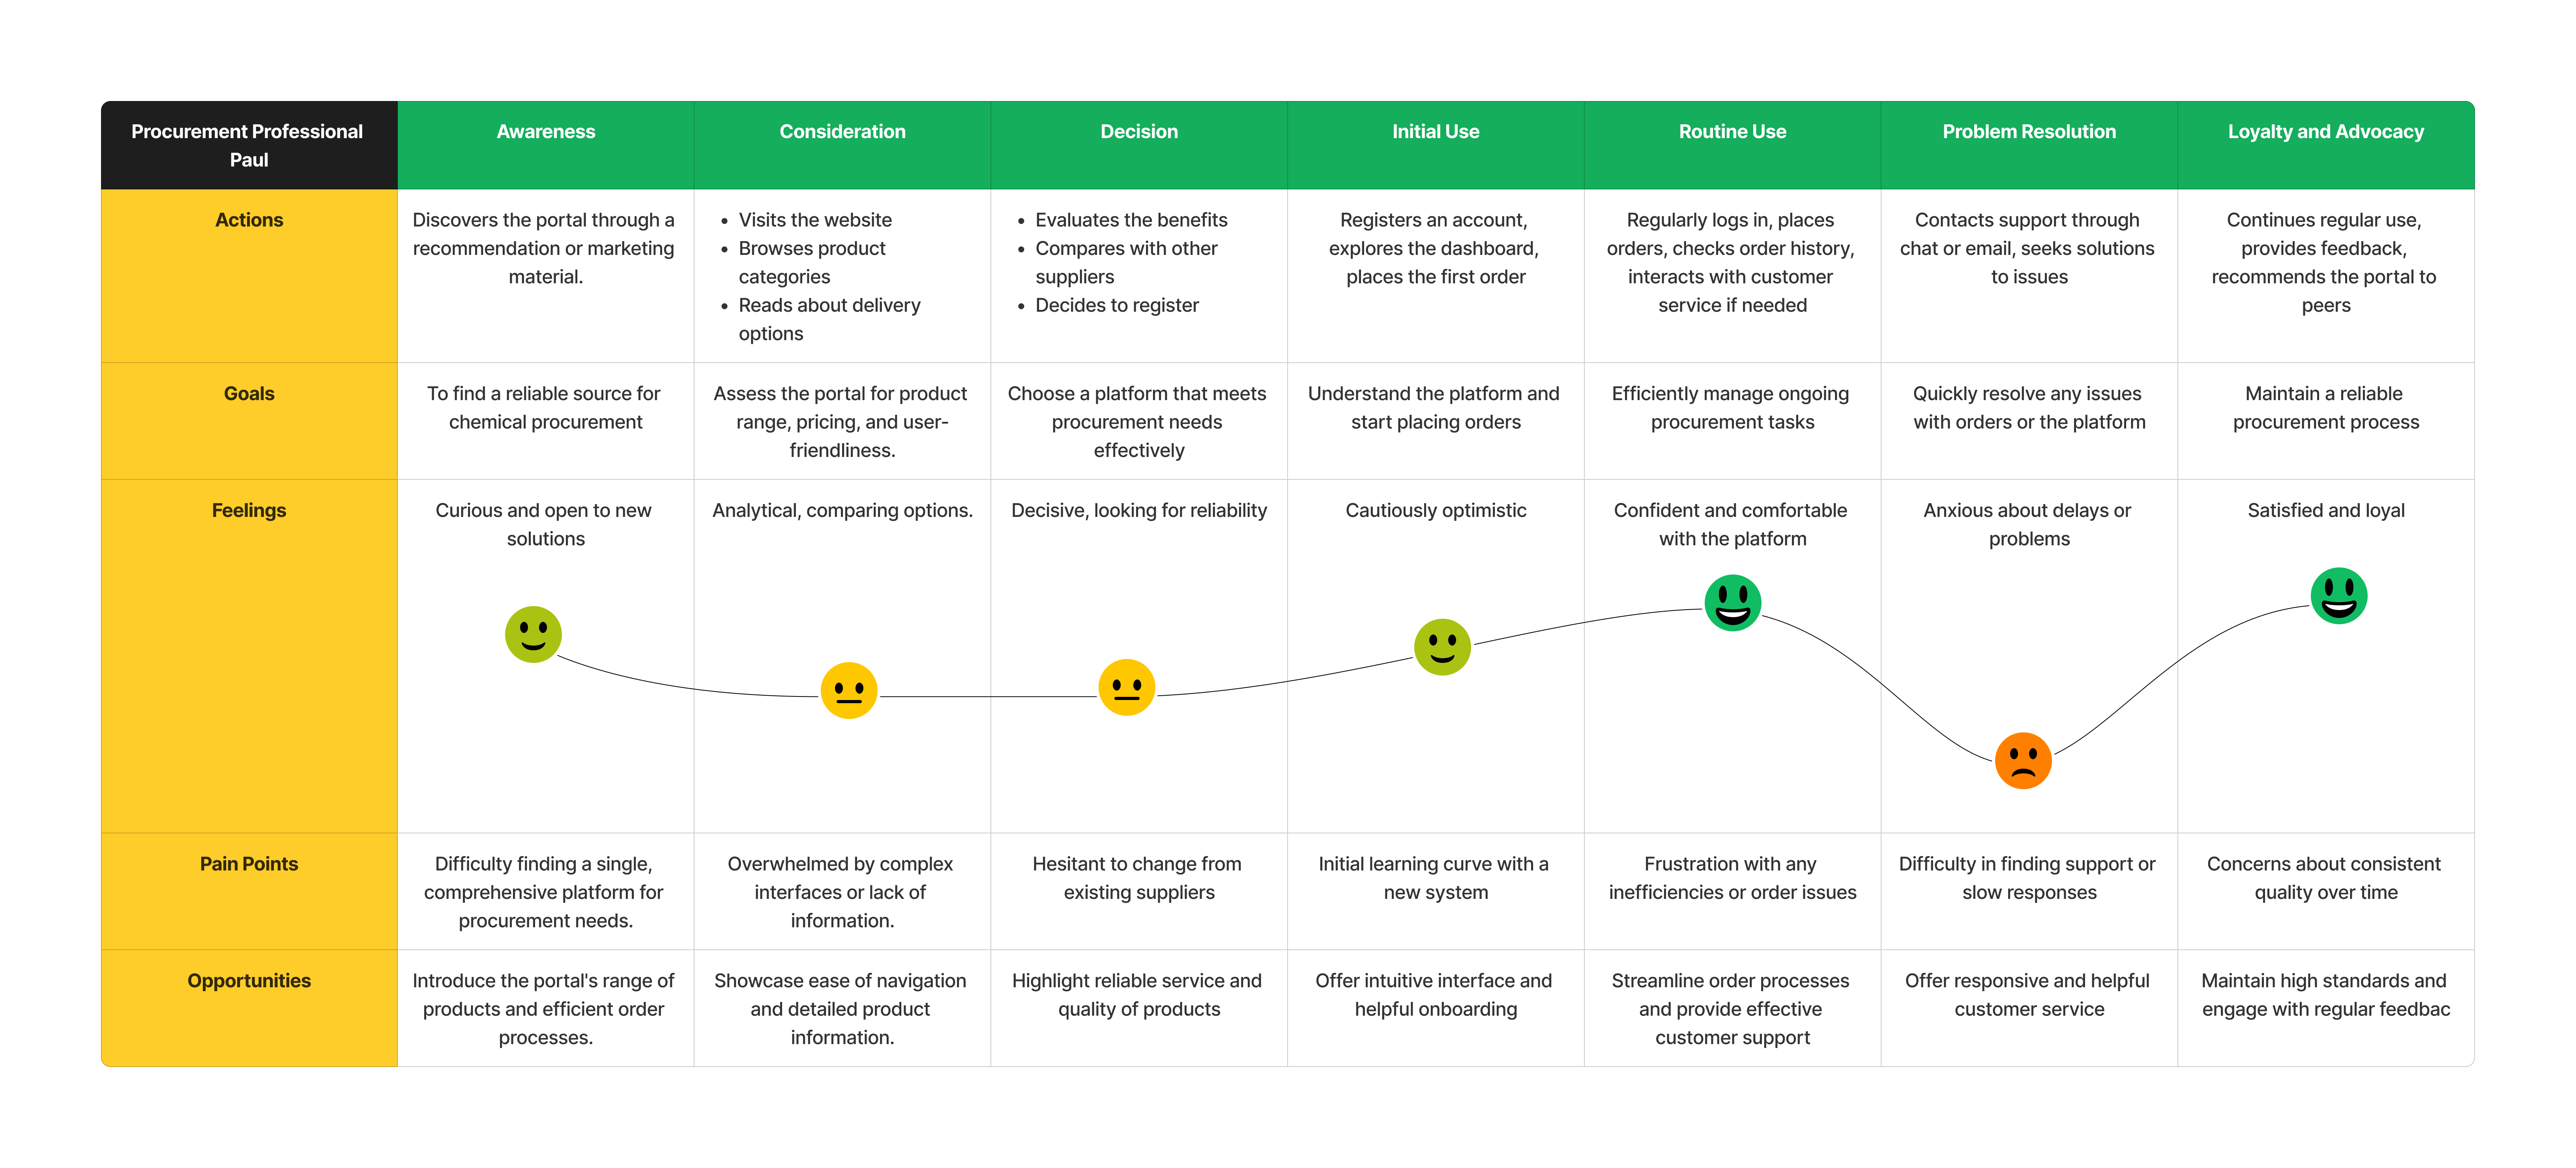
Mapping the end-to-end journeys revealed the "PDF Friction Point." We identified that users were dropping off when they had to leave the portal to find documentation in external folders.
This deep dive into research allowed me to push back on "feature bloat." By grounding the project in Persona data, we prioritized the 20% of features that provided 80% of the value.
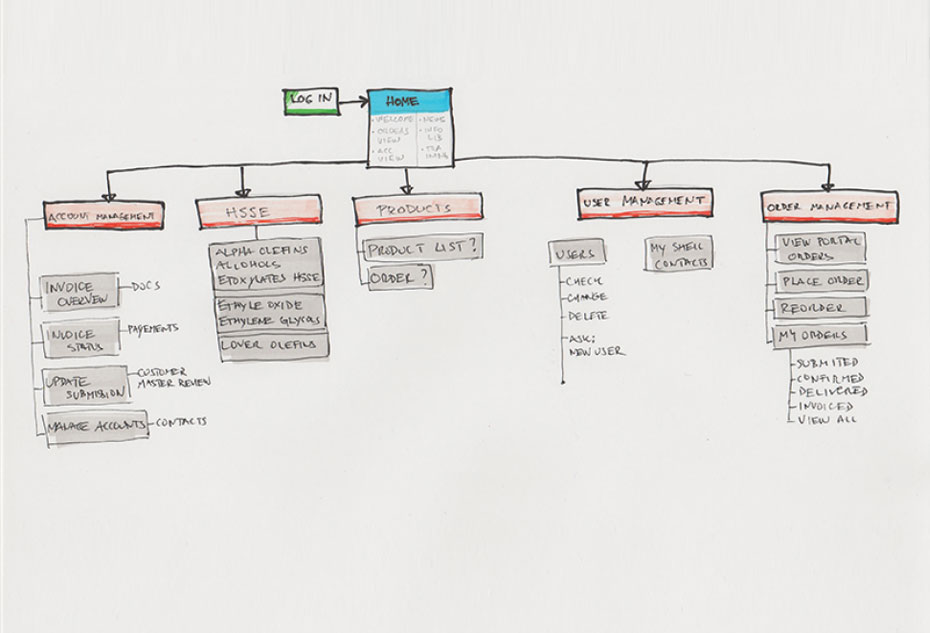
I used a "Red Route" analysis to chart every function on a frequency matrix, identifying the critical tasks that drive business value. By mapping these high-frequency actions directly to a task-based Information Architecture, I replaced the legacy "file-based" logic with a streamlined navigation model. This blueprint served as the primary guide for the remote engineering team in India, ensuring complex Salesforce state changes aligned with user intent.
Strategy is about finding the shortest path to value. By flattening the architecture, we ensured that safety specs and tracking data were accessible in two clicks or less from any screen.
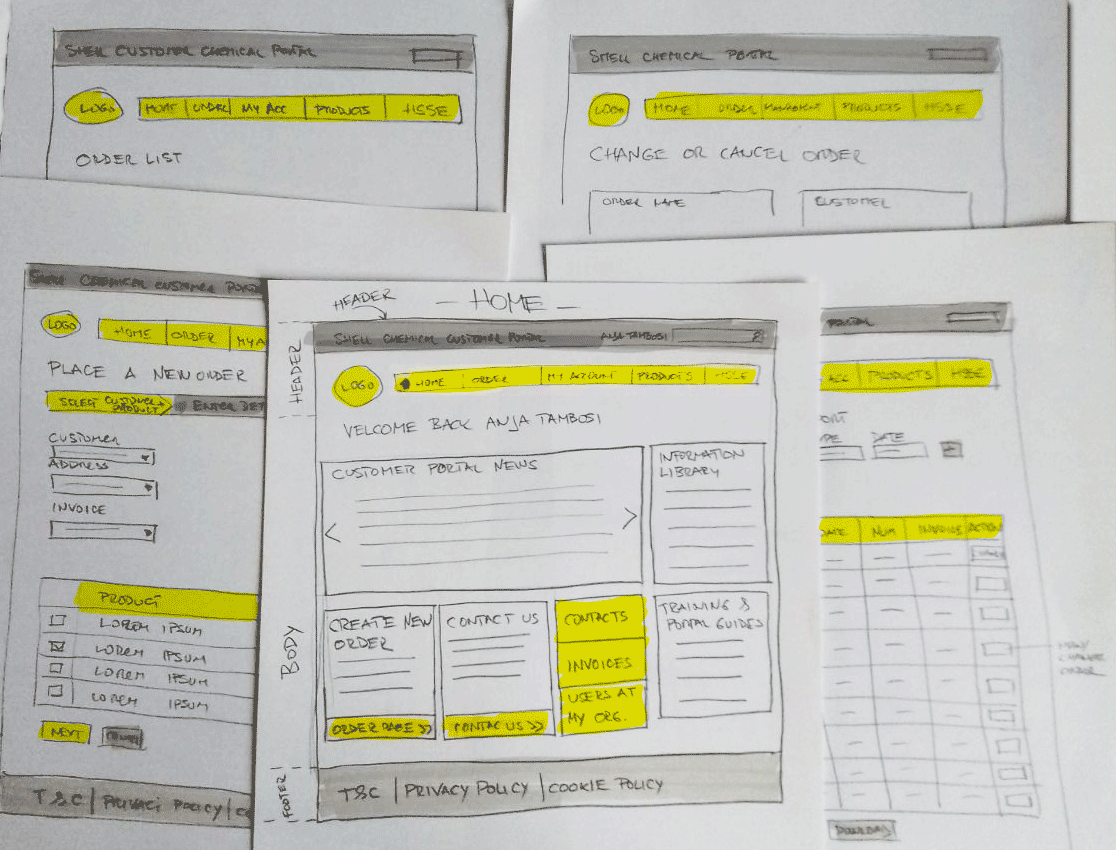
I utilized rapid sketching to explore mobile-first layouts before moving into Axure. Testing low-fidelity wireframes allowed us to iterate on the Salesforce component logic early in the process.
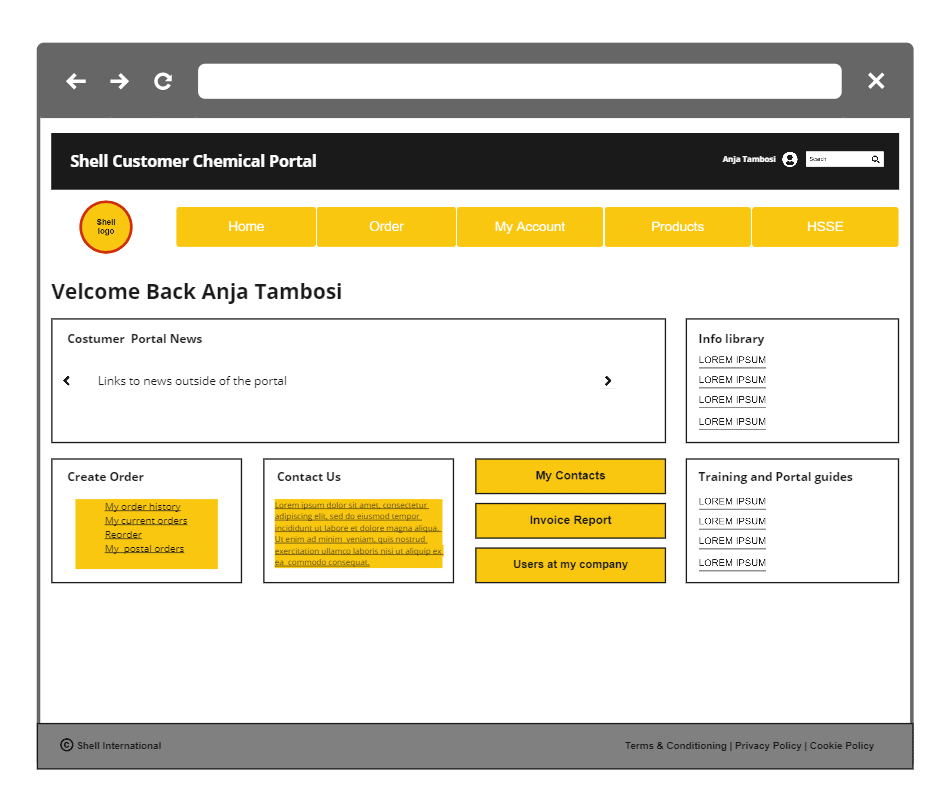
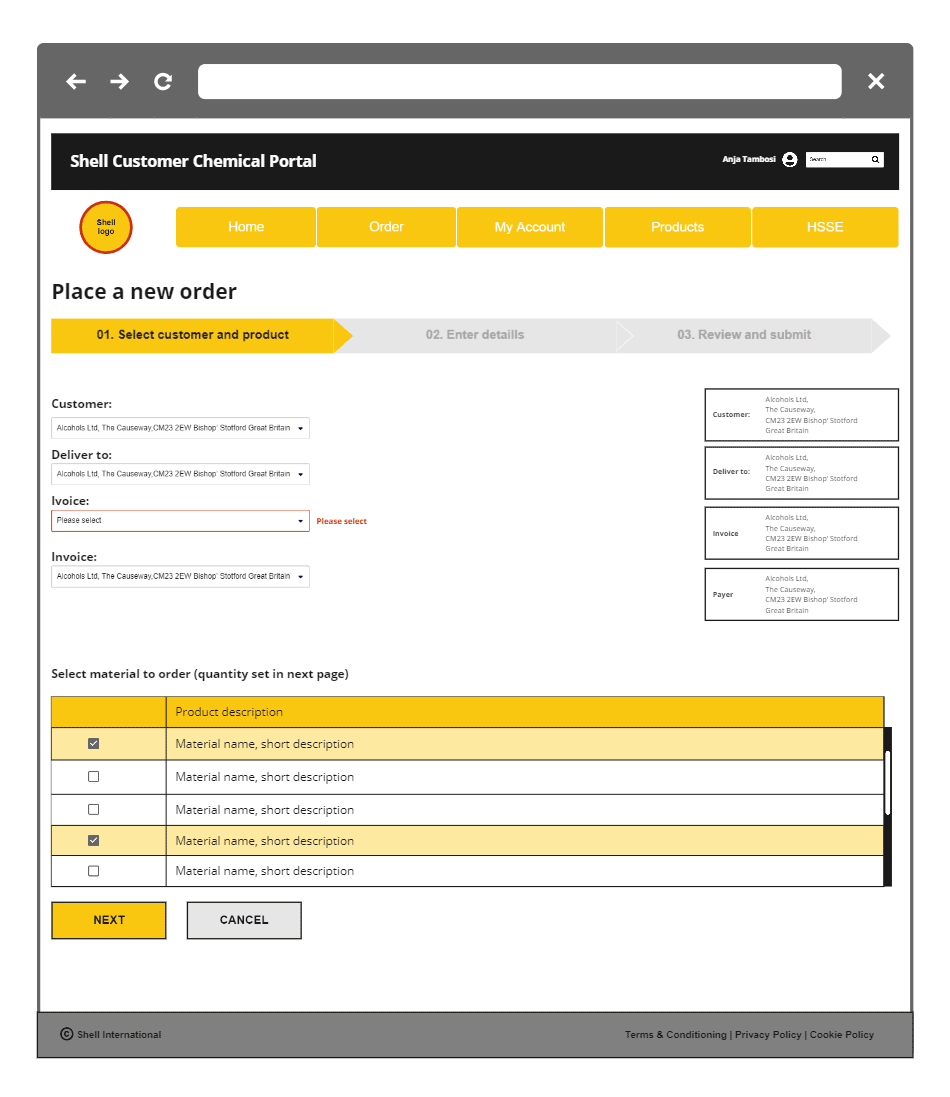

The final UI applied Shell’s global brand guidelines while respecting the technical constraints of the Salesforce Lightning ecosystem. We focused on high-contrast data tables and clear shipment status indicators.
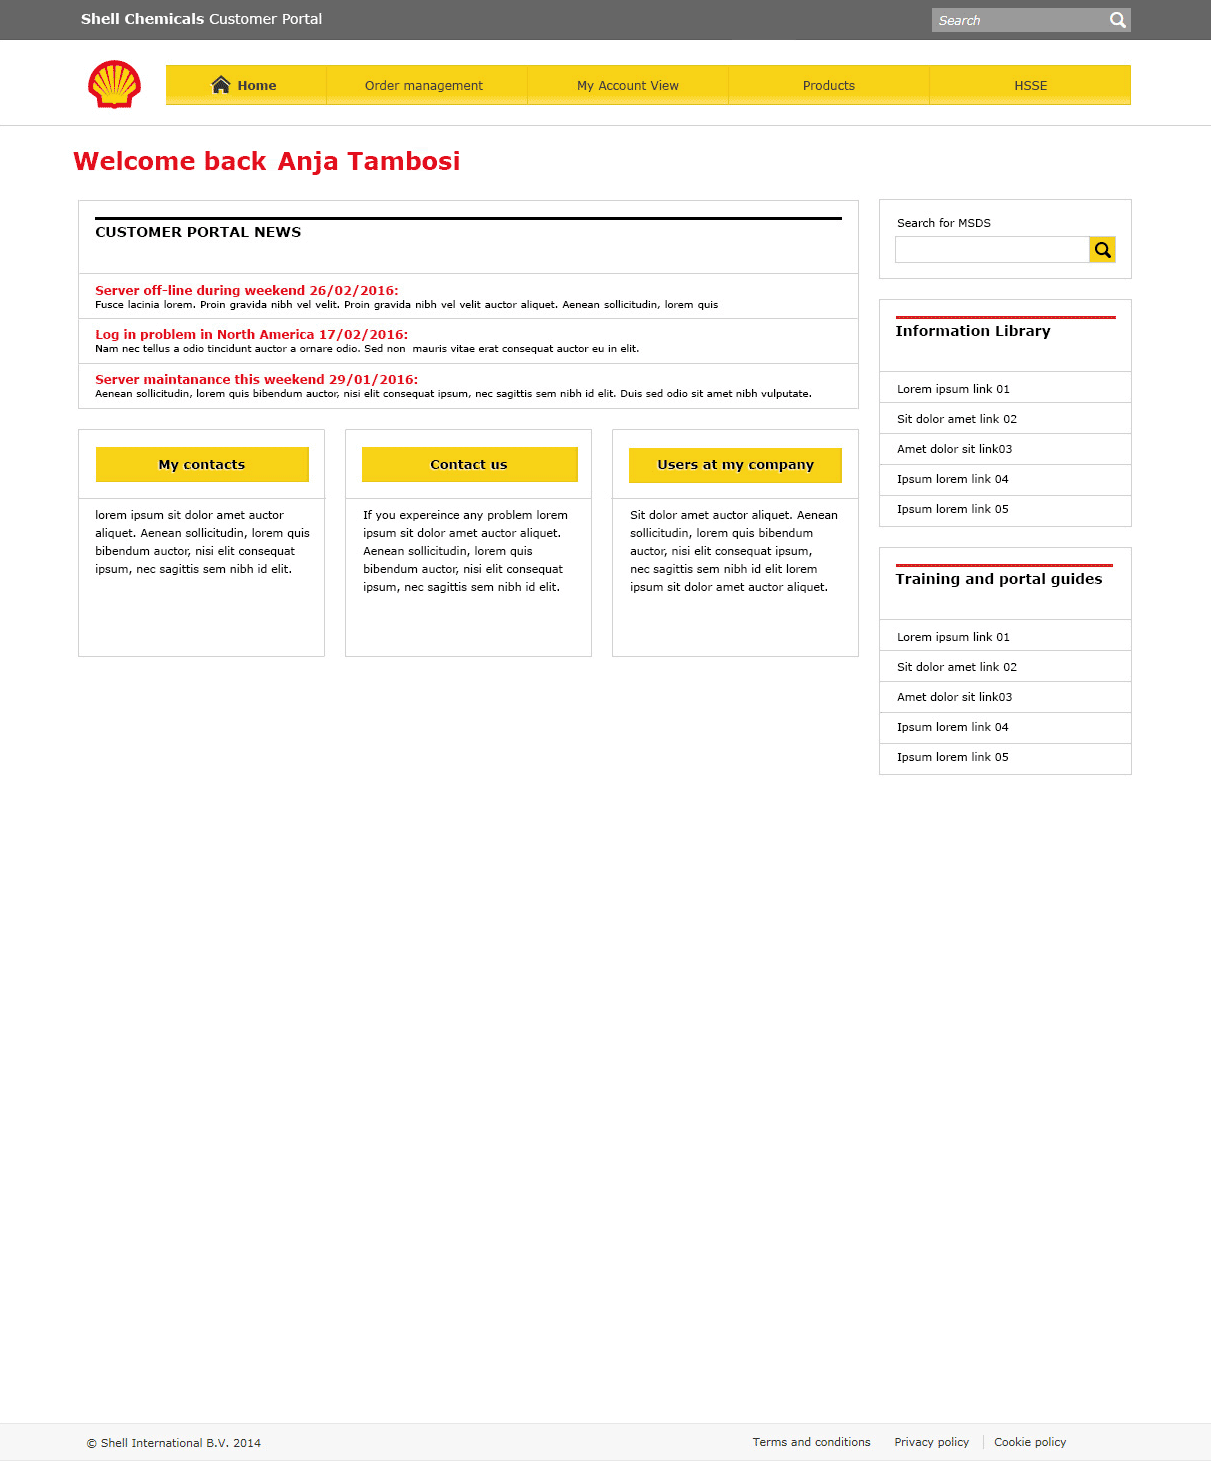
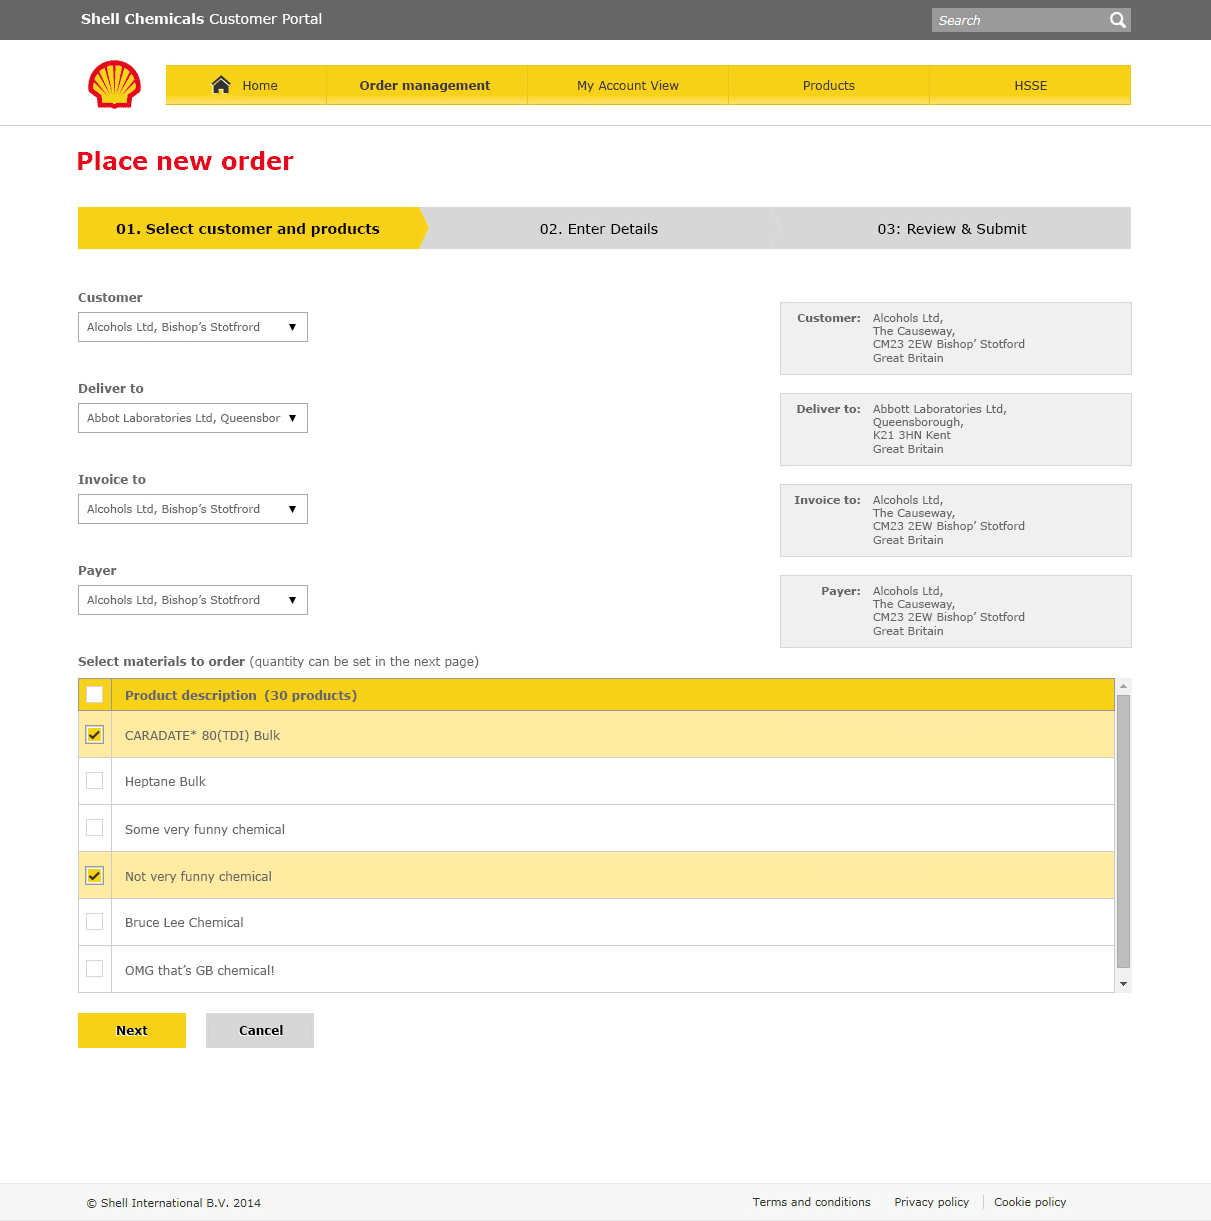

Visual clarity was the priority. For users in a busy lab or a warehouse, the UI needed to be "unmissable." High-fidelity prototypes helped validate that our touch targets worked for users in the field.
The biggest hurdle was the technical framework. I worked closely with Salesforce architects and a remote development team in India to ensure our custom UI didn't break core CRM functionality while delivering a premium Shell experience.
This project proved that even in "traditional" industries like chemicals, user-centric design is the primary driver for business growth. By solving the mobile friction and the "PDF problem," we didn't just update a website—we modernized a global sales tool.